DemosPayroll revisions
The record moves
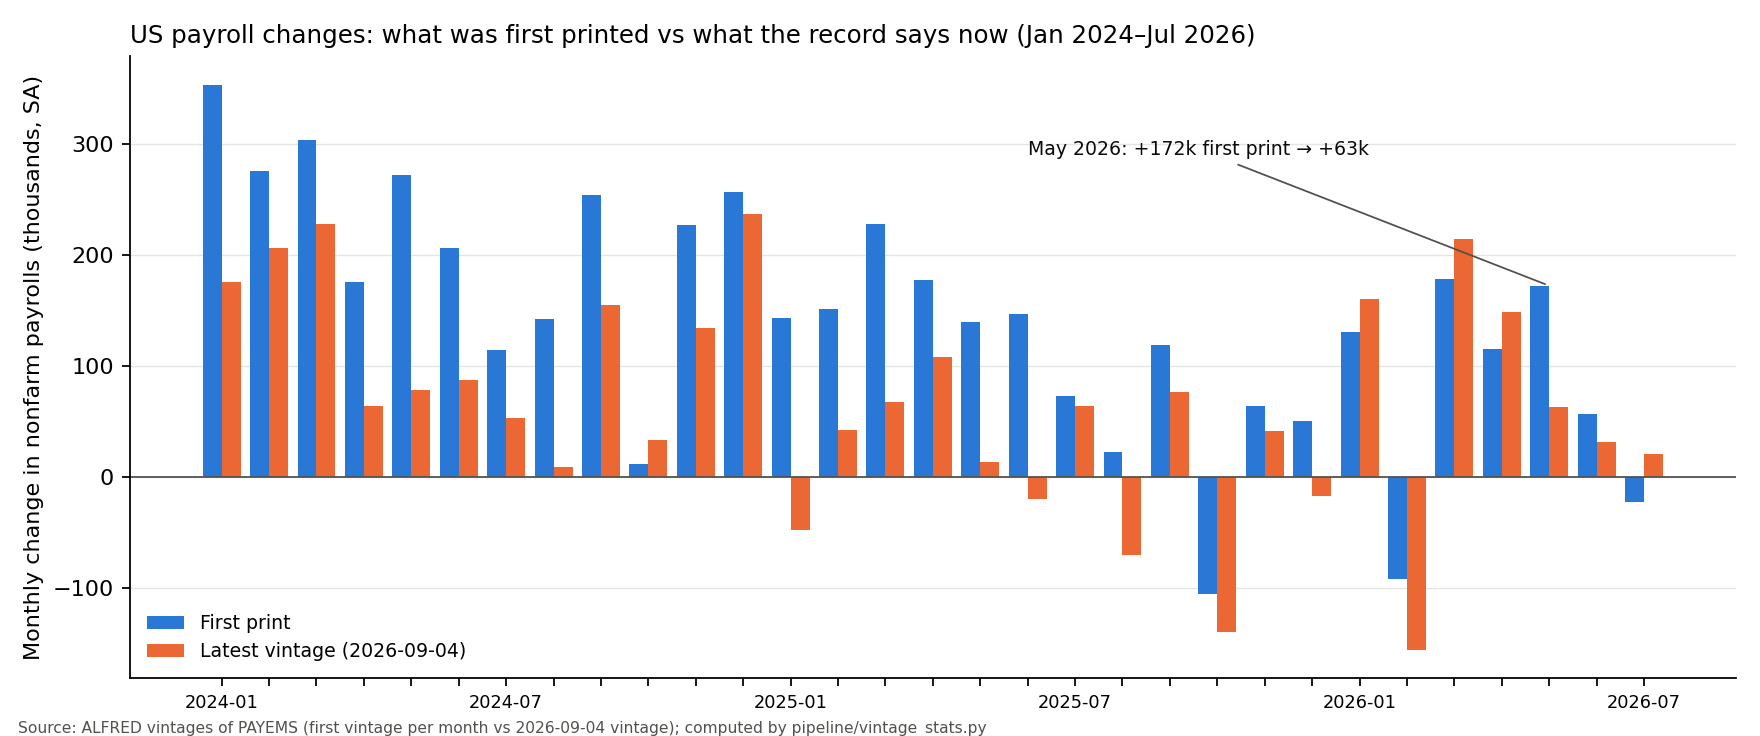
The first published figure for a month's payroll change is revised again and again. Across 31 months, the first print was later revised by 83,000 jobs on average (the 7 Aug 2026 vintage), and four times the sign flipped.
Pick a month
PAYEMS · 32 vintagesNote on the cut. Over the 31 months from January 2024 to July 2026, first-print monthly changes in US nonfarm payrolls were later revised by a mean absolute 84,000 jobs as of the 4 Sept 2026 vintage (83,000 as of the 7 Aug 2026 vintage used in the paper), and in five months the sign flipped (four at the paper’s cut). The headline uses the paper’s figures; the chart shows every vintage.
Four series, first print against latest vintage
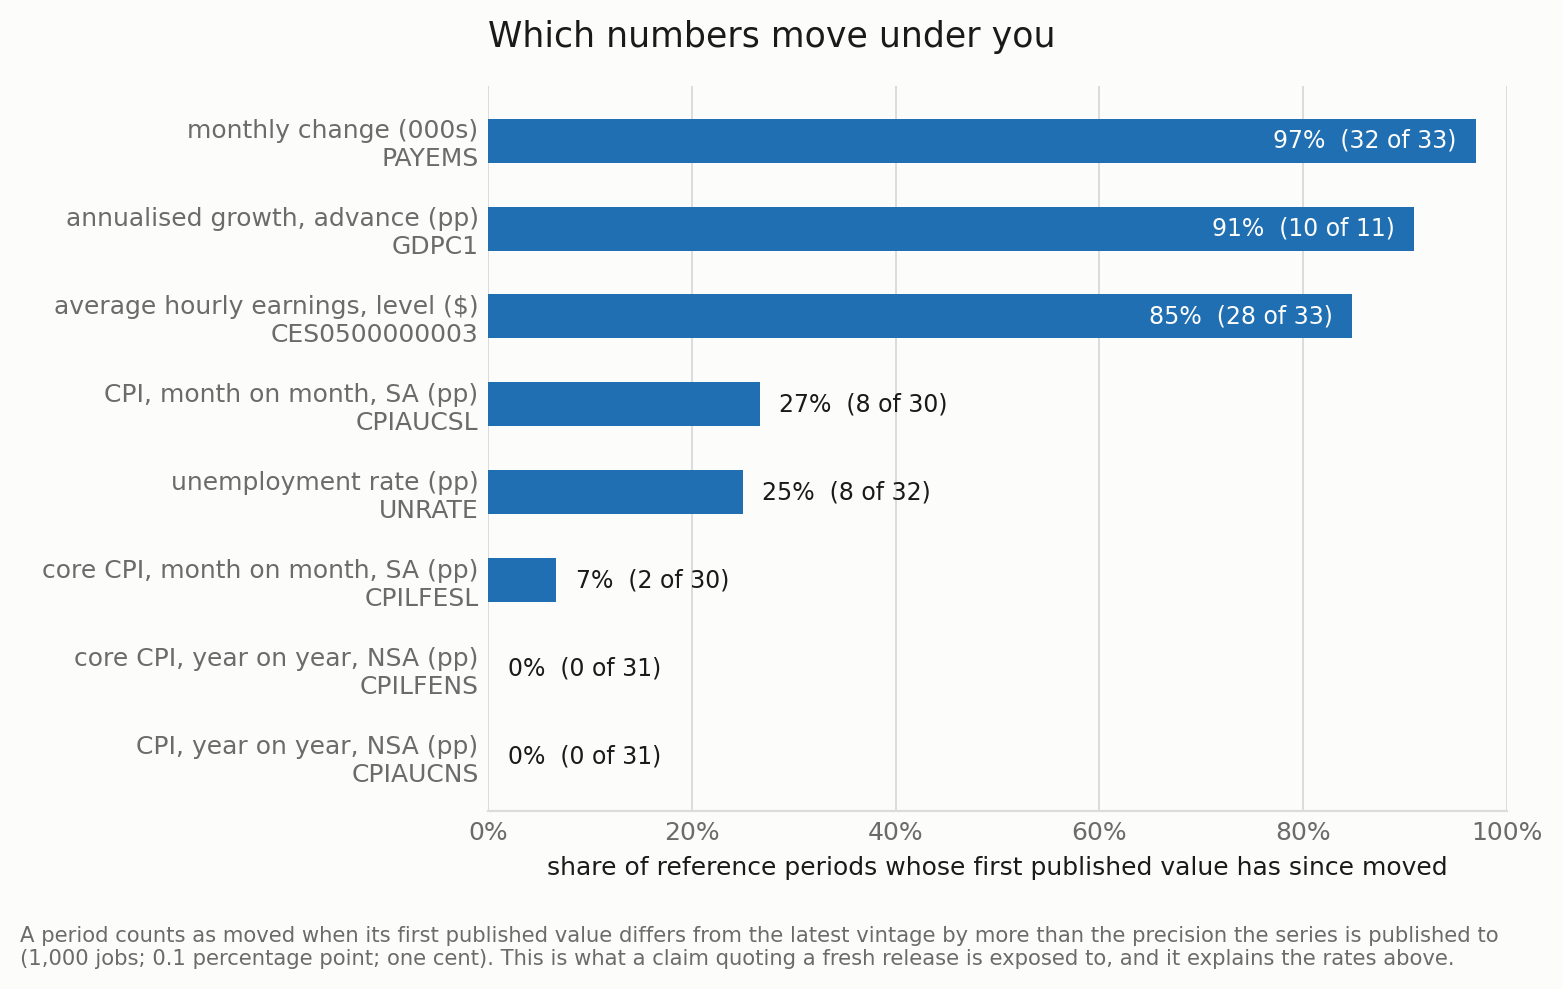
| Series | Periods | Mean |revision| | Median | Max | Sign flips | Share revised | Latest vintage |
|---|---|---|---|---|---|---|---|
| Nonfarm payrolls, monthly change (SA) (thousands of jobs) | 31 | 84.06 | 69.00 | 194.00 | 5 | 100% | 2026-09-04 |
| Unemployment rate (SA) (percent) | 30 | 0.02 | 0.00 | 0.10 | 0 | 23% | 2026-09-04 |
| CPI-U all items, MoM % (SA) (percent, 1 dp) | 29 | 0.02 | 0.00 | 0.10 | 0 | 24% | 2026-08-12 |
| Real GDP growth, BEA growth series (percent SAAR) | 10 | 0.47 | 0.45 | 0.90 | 0 | 90% | 2026-07-30 |
Revision = latest vintage minus first print for each reference period; sign flip = the sign differs between the two, zeros excluded.
Try this
Three steps- Pick a month
Choose any of the {revMonths} months, from the first print to the latest vintage.
- Follow the line
Watch the figure move from its first print through every revised vintage.
- Read the flag
See when the sign flipped, and why a faithful first print can be marked wrong today.
What it is, and how it works
What it is
Every published version of each monthly payroll figure, from the archive of past data releases, drawn as it changed.
Why it matters
- A claim checked against today's figure can be marked wrong even though it matched the record when it was made.
- The May 2026 case. The first print for May 2026 was +172k (vintage 2026-06-05); the latest vintage (2026-09-04) puts it at +63k, a revision of −109k. A verifier that ignores vintages scores every faithful restatement of the first print as false.
Data
ALFRED archival vintages from the Federal Reserve Bank of St. Louis.
Build log
- Vintage archive pulled for nine series, every ALFRED vintage from January 2024, with the download hashes recorded.
- What went wrongThe 2025 government shutdown left a gap in the vintages. Month changes are read within one vintage, so the gap changes which vintage counts as a month's first print rather than inventing one.
- The 4 September 2026 vintage arrived after the paper's cut and adds a fifth sign flip (July 2026). The page keeps the paper's figures and shows the newer vintage beside them.
Status and limits
One series, nonfarm payrolls, over 31 reference months. The headline figures are fixed at the paper's cut (the vintage of 2026-08-07); the chart includes every later vintage too. Revisions are a normal part of how statistical agencies work; the point is what they do to fact-checks, not that the first prints were wrong.
Panel C preview: India
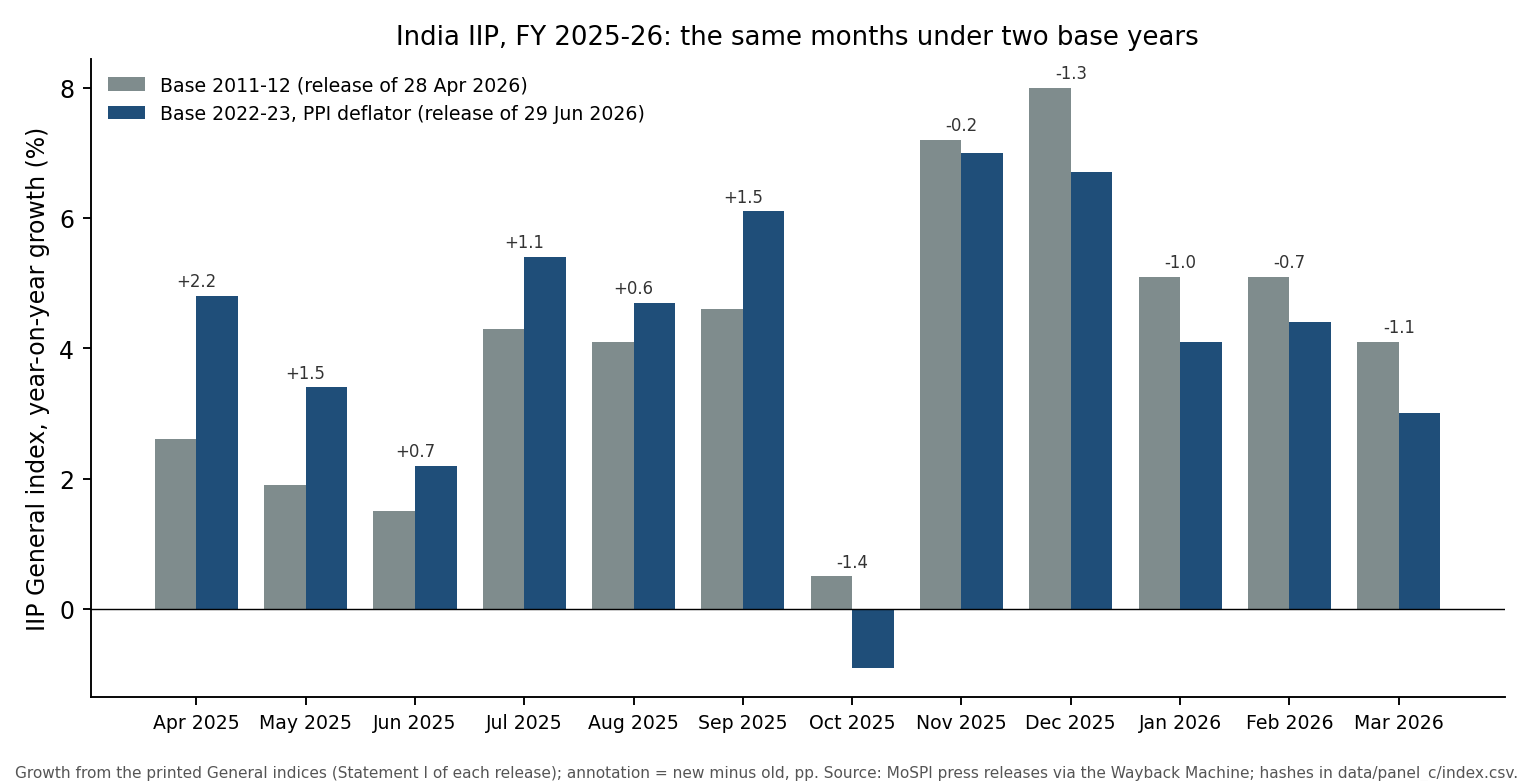
No Indian vintage archive exists; this is the start of one. In 2026 MoSPI changed the base year of the Index of Industrial Production (2011-12 to 2022-23, with a WPI-deflated series on 1 June superseded by a PPI-deflated one on 29 June) and the base year of GDP (27 February), and re-issued the quarterly GDP series on 31 August. The archive holds dated, hashed press releases captured by the Wayback Machine.
One quarter, four vintages. Real GDP growth for April to June 2025 has been printed as 7.8% (29 August 2025, base 2011-12), 6.7% (27 February 2026, new base), 6.8% (5 June 2026, provisional estimates) and 6.9% (31 August 2026, re-issue with the new producer price index and IIP).
Next demo